Glen Canyon & Lake Powell
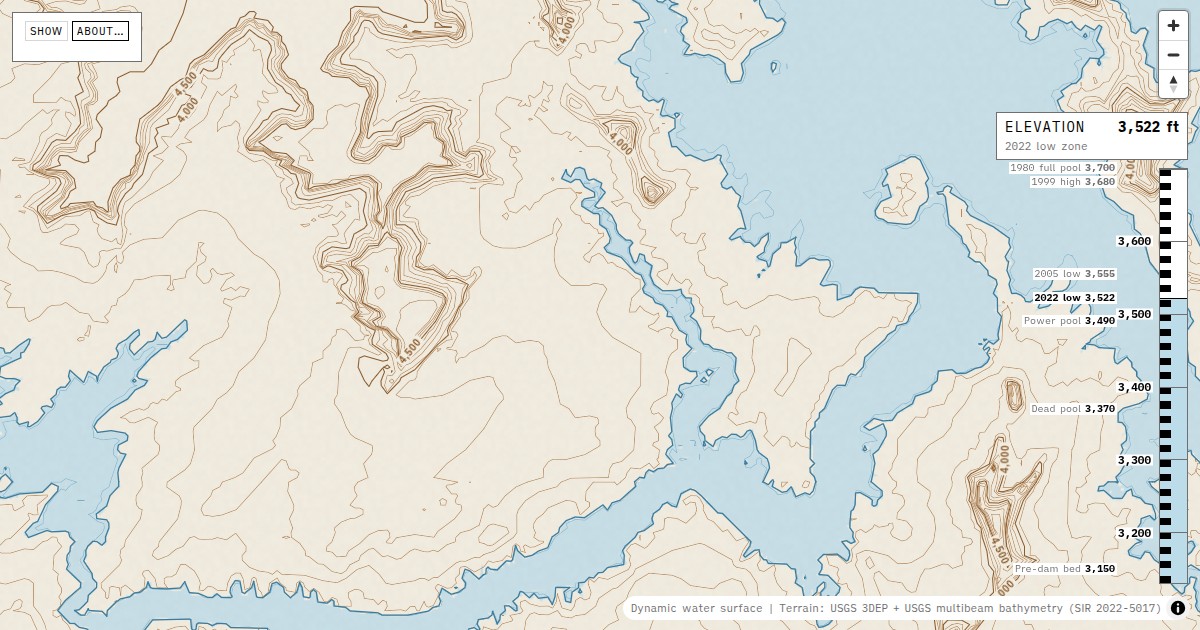
Drag one gauge from full pool to the pre-dam riverbed and watch Lake Powell drain. Every water surface you see is computed against real terrain, not painted on it: the reservoir fills the canyons it actually fills at that elevation, and the side canyons come back in the order they actually come back.
The thing that makes that possible is the terrain underneath. Above the waterline it is USGS 3DEP topography; below it, the multibeam bathymetric survey Reclamation and the USGS published as SIR 2022-5017 — the first proper measurement of the lakebed since the dam closed in 1963. I fused the two into a single continuous elevation model and tiled it, so the canyon does not stop at the old shoreline the way it does on every basemap. Elevations are feet above the NGVD 1929 datum, which is what Reclamation operates the reservoir in.
It is drawn as a 7.5-minute quadrangle, and that is a decision rather than a costume. There is no hillshade and no 3D view: shading and an oblique camera both flatter the terrain without telling you anything you can measure, and a contour sheet is the form that answers how deep, how far, how much on sight. Every line is computed in the browser — marching squares over the elevation model, 400 feet apart when you are looking at the whole reservoir and 10 feet when you are down in a side canyon. The shoreline is not a separate object. It is the contour at whatever elevation the gauge is showing, drawn by exactly the same code as the 4,000-foot line, which is why it stays crisp at any zoom instead of pixellating like the edge of a bitmap. Below it the drowned canyon carries on in soundings, at a coarser interval and a lighter blue, the way a chart carries depth.
The water plate behind those lines is a MapLibre custom protocol rather than a mesh: each tile is painted per pixel from the elevation data at the level you have asked for, so moving the gauge repaints the lake rather than moving a plane through it.
A dam is not in the terrain. 3DEP maps the ground, and the ground at Glen Canyon is the river, so below about 3,560 feet the simulated water used to run straight through the damsite and on down the Colorado to Lees Ferry. The dam is now a structure of its own, burned into every tile as it decodes, and behind it a precomputed connectivity raster answers the question a naive elevation test cannot: not is this pixel below the surface but does this pixel drain to the pool behind the dam. Weighed against Reclamation's published elevation–area curve, the naive test overstates the reservoir's surface by 8 to 35 percent; with the dam and the correction in place the model lands within 9 percent across the whole range, and within about 5 percent at full pool.
How close is it to the real lake? That question deserved an answer rather than an assurance, so the simulated shoreline is fitted against dated Sentinel-2 photographs on five dates spanning ninety feet of reservoir elevation — the 2019 high stand, the 2022 drought, four days after the 2023 record low, the recovery that September, and one from a few days before the study was run. Agreement runs from 0.849 to 0.952 by intersection over union. On the two clearest dates the average gap between our line and the photograph's is about 14 metres, along 260 kilometres of shoreline, against a terrain model sampled at 15 — which is as close as this data can be asked to come. The whole comparison is in the app, plates and failures included.
On load it asks USGS gauge 09379900 where the lake actually is today and starts there. The presets on the staff gauge are the moments worth knowing: 3,700 ft full pool, 3,555 and 3,522 ft the 2005 and 2022 lows, 3,490 ft minimum power pool where the turbines stop, 3,370 ft dead pool where the lowest outlet is stranded, and 3,130 ft the riverbed before the dam. Eleven landmarks track which arches, bays and marinas are under water at any given level, twelve gauges report what the tributaries are bringing in, and clicking anywhere on the terrain tells you that point's elevation and how far above or below the current surface it sits.
Below the dam the reading is a shape rather than a number. The plant follows the load, so the release runs on a daily cycle that no single figure shows — the app draws forty-eight hours of it and you can point at any hour. Roads, trails and the rivers above the reservoir come from OpenStreetMap, drawn as a quadrangle's black and blue plates, which is what keeps the head of the lake from ending at a cliff edge.
Two honest caveats, both visible in the app. The optional photographic and topo basemaps show the shoreline on the day they were captured, not the level you have simulated — only the terrain and the water respond to the gauge. And the capacity figures account for the roughly 1.83 million acre-feet of Colorado and San Juan sediment that has displaced 6.79% of the reservoir's original storage since 1963, which is why the numbers do not match the design capacity you will find quoted elsewhere.
The interface is deliberately plain — monochrome and flat — so the only colour in the room is the work: the brown plate, the blue, and the water standing in the gauge at the level the map is drawn at.